# 环境
- Python:3.6.5 OpenCV 4.1.2
- C++:OpenCV 4.1.2
- JS:OpenCV 4.5.0
环境搭建可参考:B 站视频
# 知识点
图像直方图的解释:
图像直方图是图像像素值的统计学特征、计算代价较小,具有图像平移、旋转、缩放不变性等众多优点,广泛地应用于图像处理的各个领域,特别是灰度图像的阈值分割、基于颜色的图像检索以及图像分类、反向投影跟踪。常见的分为
- 灰度直方图
- 颜色直方图
Bins 是指直方图的大小范围, 对于像素值取值在 0~255 之间的,可以有 256 个 bin,此外还可以有 16、32、48、128 个 bin 等,256 除以 bin 的大小应该是整数倍。
相关 API:
void calcHist( const Mat* images,
               int nimages,
               const int* channels,
               InputArray mask,
               OutputArray hist,
               int dims,
               const int* histSize,
               const float** ranges,
               bool uniform = true,
               bool accumulate = false );
- images:输入的图像或数组,它们的深度必须为 CV_8U, CV_16U 或 CV_32F 中的一类,尺寸必须相同;
- nimages:输入图像的个数,也就是第一个参数中存放了几张图像;
- channels:需要进行统计的通道数组,第一个数组通道从
0到image[0].channels()-1,第二个数组从image[0].channels()到images[0].channels()+images[1].channels()-1,以后的数组以此类推; - mask:可选的操作掩码。如果此掩码不为空,那么它必须为 8 位并且尺寸要和输入图像 images [i] 一致。非零掩码用于标记出统计直方图的数组元素数据;
- hist:输出的目标直方图,只进行一个特征的直方统计时,输出的目标直方图可被认为是一个一维数组,长度为 bins 的大小;
- dims:需要进行统计的特征的数目,
dims=1表示我们只进行像素值的特征统计; - histSize:每个维度的直方图尺寸的数组;
- ranges:每个维度中 bin 的取值范围;
- uniform:直方图是否均匀的标识符,有默认值 true;
- accumulate:累积标识符,有默认值 false,若为 true,直方图再分配阶段不会清零。此功能主要是允许从多个阵列中计算单个直方图或者用于再特定的时间更新直方图。
# C++ 代码
#ifndef DAY17
#define DAY17
#include <opencv2/opencv.hpp>
#include <iostream>
using namespace std;
using namespace cv;
Mat src;
const char* winTitle = "input image";
void showHistogram();
void day17() {
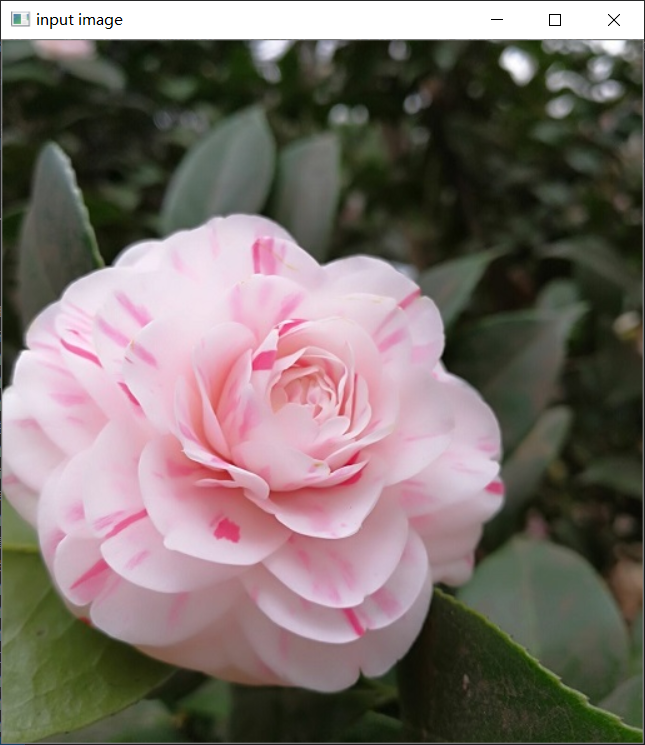
src = imread("E:\\_Image\\OpenCVTest\\flower.jpg");
if (src.empty()) {
printf("could not load image...\n");
return;
}
namedWindow(winTitle, WINDOW_AUTOSIZE);
imshow(winTitle, src);
showHistogram();
waitKey();
}
void showHistogram() {
// 三通道分离
vector<Mat> bgr_plane;
split(src, bgr_plane);
// 定义参数变量
const int ninages = 1;
const int channels[] = { 0 };
const int dims = 1;
//const int bins[] = { 16 };
const int bins[] = { 256 };
float hranges[] = { 0, 255 };
const float* ranges[] = { hranges };
Mat b_hist;
Mat g_hist;
Mat r_hist;
// 计算Blue, Green, Red通道的直方图
calcHist(&bgr_plane[0], ninages, channels, Mat(), b_hist, dims, bins, ranges);
calcHist(&bgr_plane[1], ninages, channels, Mat(), g_hist, dims, bins, ranges);
calcHist(&bgr_plane[2], ninages, channels, Mat(), r_hist, dims, bins, ranges);
// 显示直方图
int hist_w = 512;
int hist_h = 400;
int bin_w = cvRound((double)hist_w / bins[0]);
Mat histImage(hist_h, hist_w, CV_8UC3, Scalar(255, 255, 255));
Mat histBlue(hist_h, hist_w, CV_8UC3, Scalar(255, 255, 255));
Mat histGreen(hist_h, hist_w, CV_8UC3, Scalar(255, 255, 255));
Mat histRed(hist_h, hist_w, CV_8UC3, Scalar(255, 255, 255));
// 归一化直方图数据,范围是[0, hist_h],
normalize(b_hist, b_hist, 0, hist_h, NORM_MINMAX, -1, Mat());
normalize(g_hist, g_hist, 0, hist_h, NORM_MINMAX, -1, Mat());
normalize(r_hist, r_hist, 0, hist_h, NORM_MINMAX, -1, Mat());
// 绘制直方图,注意画布的原点在左上角
Rect rect;
for (int i = 1; i < bins[0]; i++) {
// 绘制直方折线图
line(histImage, Point(bin_w*(i - 1), hist_h - cvRound(b_hist.at<float>(i - 1))),
Point(bin_w*(i), hist_h - cvRound(b_hist.at<float>(i))), Scalar(255, 0, 0), 2, 8, 0);
line(histImage, Point(bin_w*(i - 1), hist_h - cvRound(g_hist.at<float>(i - 1))),
Point(bin_w*(i), hist_h - cvRound(g_hist.at<float>(i))), Scalar(0, 255, 0), 2, 8, 0);
line(histImage, Point(bin_w*(i - 1), hist_h - cvRound(r_hist.at<float>(i - 1))),
Point(bin_w*(i), hist_h - cvRound(r_hist.at<float>(i))), Scalar(0, 0, 255), 2, 8, 0);
// 蓝色通道的直方图
rect.x = bin_w * (i - 1);
rect.y = hist_h - cvRound(b_hist.at<float>(i - 1));
rect.width = bin_w;
rect.height = cvRound(b_hist.at<float>(i - 1));
rectangle(histBlue, rect, Scalar(255, 0, 0), -1, LINE_8, 0);
// 绿色通道的直方图
rect.y = hist_h - cvRound(g_hist.at<float>(i - 1));
rect.height = cvRound(g_hist.at<float>(i - 1));
rectangle(histGreen, rect, Scalar(0, 255, 0), -1, LINE_8, 0);
// 红色通道的直方图
rect.y = hist_h - cvRound(r_hist.at<float>(i - 1));
rect.height = cvRound(r_hist.at<float>(i - 1));
rectangle(histRed, rect, Scalar(0, 0, 255), -1, LINE_8, 0);
}
// 显示直方图
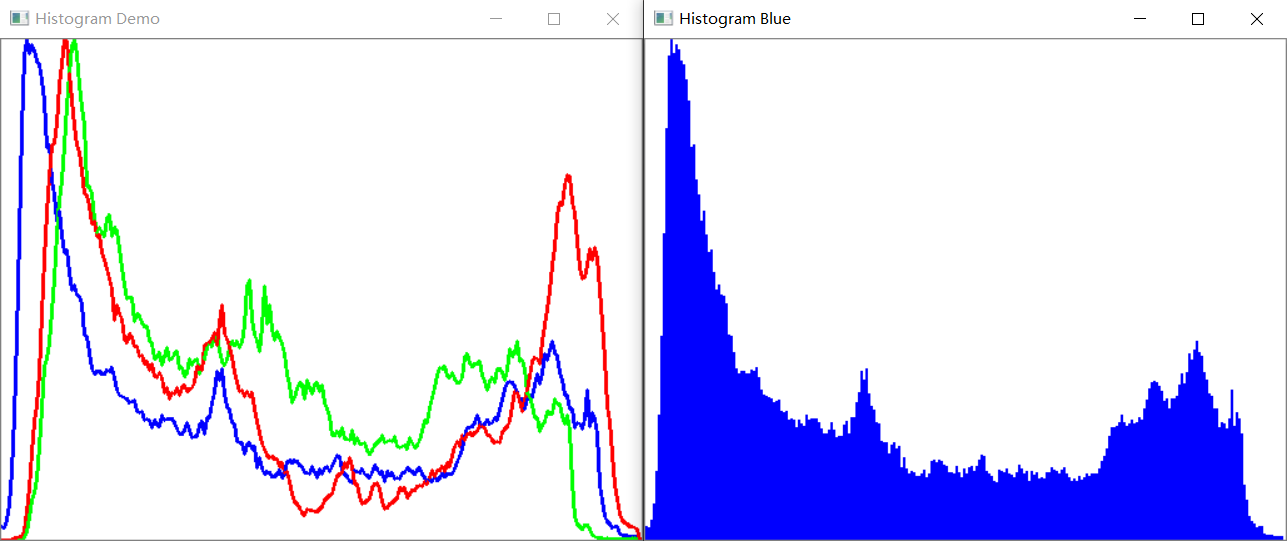
imshow("Histogram Demo", histImage);
imshow("Histogram Blue", histBlue);
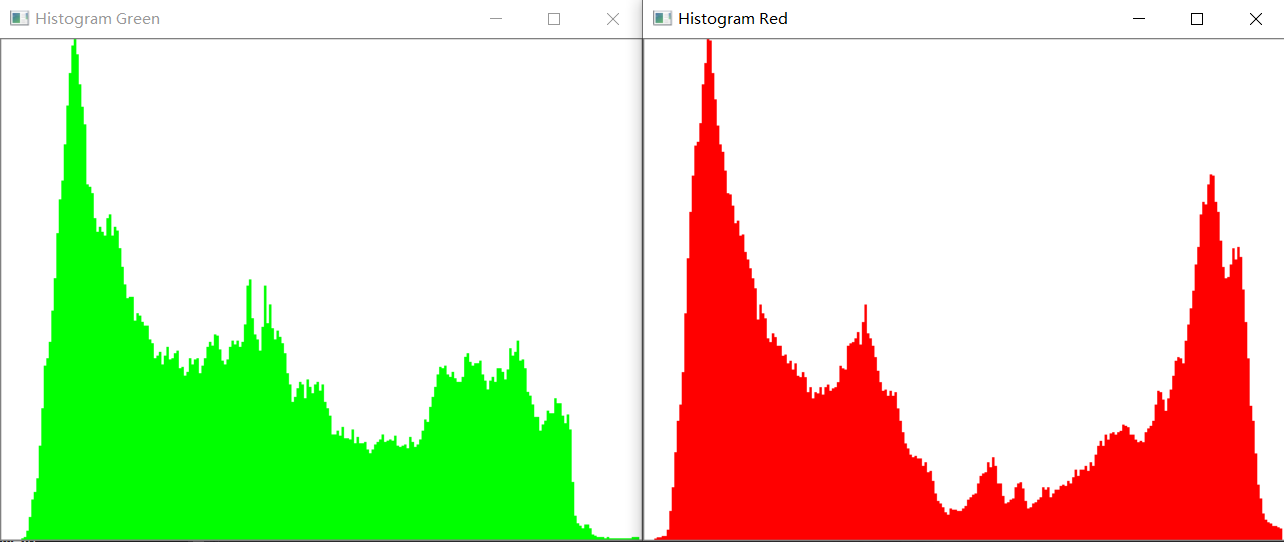
imshow("Histogram Green", histGreen);
imshow("Histogram Red", histRed);
}
#endif // !DAY17
# 结果展示